Inventory Growth and Market Balance
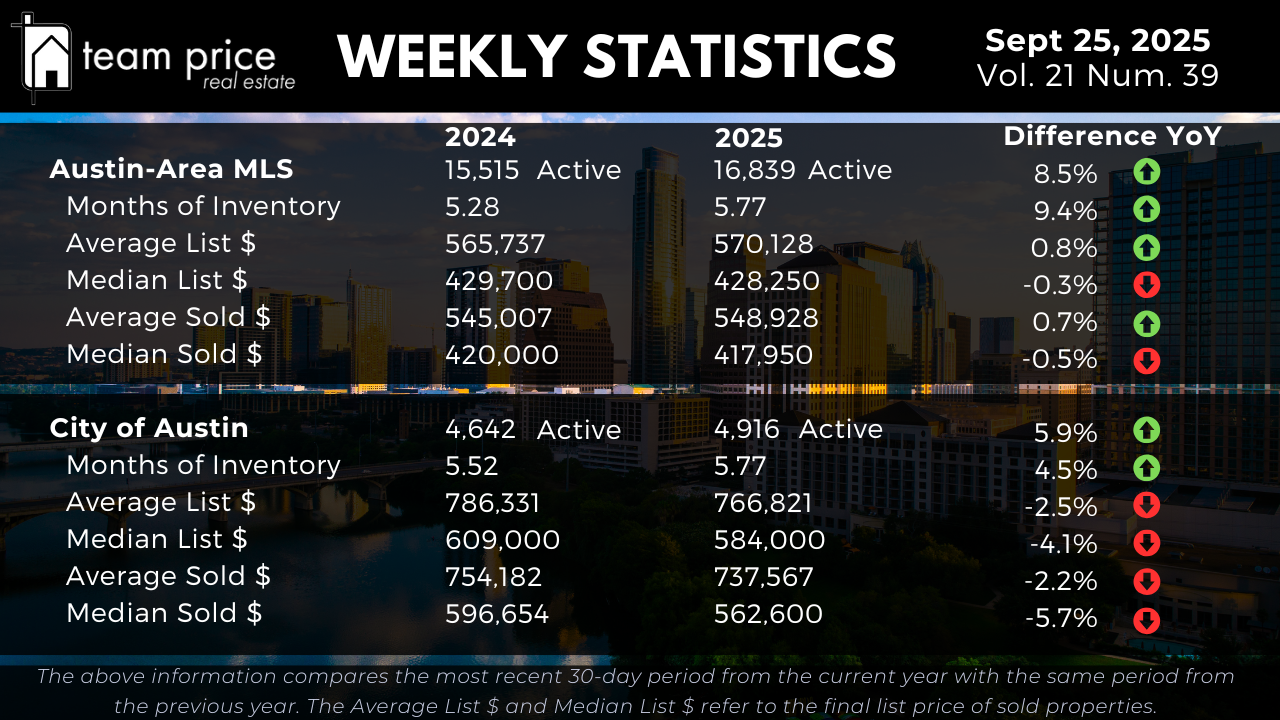
Active residential listings across the Austin-Area MLS reached 16,839 in late September 2025, an 8.5 percent increase from 15,515 one year ago. Compared to last week’s 16,878 listings, inventory has edged slightly lower, though the broader trend remains higher year over year. Months of Inventory has also expanded from 5.28 to 5.77, a 9.4 percent rise that signals slower absorption and more homes staying on the market longer.
Inside the City of Austin, the pattern is similar though more modest. Active listings rose 5.9 percent year over year, climbing from 4,642 in 2024 to 4,916 today. Months of Inventory moved from 5.52 to 5.77, a 4.5 percent increase. These shifts confirm that buyers now have more choices than a year ago and sellers are facing more competition, even as week-over-week numbers suggest the market may be stabilizing.
Pricing Stability Across the MLS
Pricing across the Austin-Area MLS has remained mostly flat over the past year, with only minor adjustments. The average list price for active homes is $570,128, up 0.8 percent from $565,737 in 2024. The median list price, however, slipped slightly by 0.3 percent, moving from $429,700 to $428,250. On the sales side, the average sold price rose 0.7 percent year over year, from $545,007 to $548,928, while the median sold price dipped 0.5 percent from $420,000 to $417,950.
Compared to last week, these values have barely shifted, underscoring that while inventory is higher, prices are holding steady. This combination of increased supply and stable pricing reflects a market leaning toward balance rather than rapid appreciation or sharp declines.
Pricing Trends in the City of Austin
Within the City of Austin, the data shows more downward pressure on values. The average list price fell 2.5 percent year over year, dropping from $786,331 to $766,821. The median list price declined even further, down 4.1 percent from $609,000 to $584,000. Closed sales followed the same path. The average sold price decreased 2.2 percent year over year, falling from $754,182 to $737,567. The median sold price declined 5.7 percent, from $596,654 to $562,600.
Week-over-week comparisons reinforce this softness. The city’s median sold price has slipped from last week’s levels, confirming that Austin’s core remains under modest but steady pressure. For buyers, this translates to increased negotiating power. For sellers, it highlights the importance of realistic pricing in a market where values are trending gently downward.
Negotiation and Buyer Leverage
Negotiation continues to shape the market across the Austin-Area MLS. So far this month, 69.24 percent of closed sales have transacted below the list price, up from 65.95 percent last month. At the same time, 18.37 percent of sales have closed exactly at asking, a decline from 21.86 percent in August. Roughly 12.39 percent of sales have closed above asking, nearly flat from last month’s 12.19 percent but lower than the 13.24 percent recorded in July 2024.
The average sold-to-list price ratio now stands at 96.77 percent, a clear indicator that sellers are conceding on price in most transactions. Buyers not only have more options but also more leverage at the negotiating table.
Regional and ZIP Code Variations
Conditions remain highly localized across Central Texas. Out of the 30 tracked cities, 11 (37 percent) posted month-over-month price increases, while 19 (63 percent) recorded declines. Year over year, only 8 cities (27 percent) saw gains, while 22 (73 percent) registered losses. None of the tracked cities are above their 12-month peak, underscoring the widespread nature of the correction.
At the ZIP code level, 25 of the 75 tracked areas (33 percent) reported month-over-month increases, while 49 (65 percent) showed declines. Year over year, 22 ZIP codes (29 percent) posted gains, while 53 (71 percent) declined. Only one ZIP code is above its 12-month peak, leaving 74 still below. These figures highlight how uneven the recovery is, with pockets of resilience but the majority still lagging.
Prices Relative to Peak Levels
Compared to the highs of 2022 and 2023, prices across both the Austin-Area MLS and the City of Austin remain significantly lower. In the MLS overall, the average list price is 12.4 percent below its March 2023 peak, while the median list price is down 16.7 percent from May 2022. The average sold price has fallen 17.3 percent from May 2022, and the median sold price is down 21.9 percent. On a price-per-square-foot basis, current values are 23 to 24 percent below peak.
Inside the City of Austin, the picture is similar. The average sold price is 14.9 percent under its May 2022 high, and the median sold price has dropped 18.2 percent. On a price-per-square-foot basis, Austin homes are selling 24 to 27 percent below their 2022 highs. The only measure to set a new high is the city’s average list price, which reached $967,613 this September, reflecting both the presence of higher-end listings and the widening gap between asking and achieved sale prices.
Market Outlook
The Austin housing market as of late September 2025 is firmly in a period of balance. Inventory levels are higher than both last year and last month, absorption has slowed, and most sales are closing under list price. Across the Austin-Area MLS, year-over-year pricing is essentially flat, while the City of Austin is seeing more noticeable declines, especially in median values.
For buyers, conditions are favorable: more listings, slower competition, and measurable negotiating leverage. For sellers, success hinges on competitive pricing and flexibility in contract terms. For investors, the message is one of opportunity: while the rapid appreciation of recent years has cooled, today’s environment offers a steadier landscape for disciplined acquisitions and long-term positioning.